Retrieve data from web sources and APIs
Kotlin Notebook provides a powerful platform for accessing and manipulating data from various web sources and APIs. It simplifies data extraction and analysis tasks by offering an iterative environment where every step can be visualized for clarity. This makes it particularly useful when exploring APIs you are not familiar with.
When used in conjunction with the Kotlin DataFrame library, Kotlin Notebook not only enables you to connect to and fetch JSON data from APIs but also assists in reshaping this data for comprehensive analysis and visualization.
Before you start
Kotlin Notebook relies on the Kotlin Notebook plugin, which is bundled and enabled in IntelliJ IDEA by default.
If the Kotlin Notebook features are not available, ensure the plugin is enabled. For more information, see Set up an environment.
Create a new Kotlin Notebook:
Select File | New | Kotlin Notebook.
In the Kotlin Notebook, import the Kotlin DataFrame library by running the following command:
%use dataframe
Fetch data from an API
Fetching data from APIs using the Kotlin Notebook with the Kotlin DataFrame library is achieved through the .read() function, which is similar to retrieving data from files, such as CSV or JSON. However, when working with web-based sources, you might require additional formatting to transform the raw API data into a structured format.
Let's look at an example of fetching data from the YouTube Data API:
Open your Kotlin Notebook file (
.ipynb).Import the Kotlin DataFrame library, which is essential for data manipulation tasks. This is done by running the following command in a code cell:
%use dataframeSecurely add your API key in a new code cell, which is necessary for authenticating requests to the YouTube Data API. You can obtain your API key from the credentials tab:
val apiKey = "YOUR-API_KEY"Create a load function that takes a path as a string and uses the DataFrame's
.read()function to fetch data from the YouTube Data API:fun load(path: String): AnyRow = DataRow.read("https://www.googleapis.com/youtube/v3/$path&key=$apiKey")Organize the fetched data into rows and handle the YouTube API's pagination through the
nextPageToken. This ensures you gather data across multiple pages:fun load(path: String, maxPages: Int): AnyFrame { // Initializes a mutable list to store rows of data. val rows = mutableListOf<AnyRow>() // Sets the initial page path for data loading. var pagePath = path do { // Loads data from the current page path. val row = load(pagePath) // Adds the loaded data as a row to the list. rows.add(row) // Retrieves the token for the next page, if available. val next = row.getValueOrNull<String>("nextPageToken") // Updates the page path for the next iteration, including the new token. pagePath = path + "&pageToken=" + next // Continues loading pages until there's no next page. } while (next != null && rows.size < maxPages) // Concatenates and returns all loaded rows as a DataFrame. return rows.concat() }Use the previously defined
load()function to fetch data and create a DataFrame in a new code cell. This example fetches data, or in this case, videos related to Kotlin, with a maximum of 50 results per page, up to a maximum of 5 pages. The result is stored in thedfvariable:val df = load("search?q=kotlin&maxResults=50&part=snippet", 5) dfFinally, extract and concatenate items from the DataFrame:
val items = df.items.concat() items
Clean and refine data
Cleaning and refining data are crucial steps in preparing your dataset for analysis. The Kotlin DataFrame library offers powerful functionalities for these tasks. Methods like move, concat, select, parse, and join are instrumental in organizing and transforming your data.
Let's explore an example where the data is already fetched using YouTube's data API. The goal is to clean and restructure the dataset to prepare for in-depth analysis:
You can start by reorganizing and cleaning your data. This involves moving certain columns under new headers and removing unnecessary ones for clarity:
val videos = items.dropNulls { id.videoId } .select { id.videoId named "id" and snippet } .distinct() videosChunk IDs from the cleaned data and load corresponding video statistics. This involves breaking the data into smaller batches and fetching additional details:
val statPages = clean.id.chunked(50).map { val ids = it.joinToString("%2C") load("videos?part=statistics&id=$ids") } statPagesConcatenate the fetched statistics and select relevant columns:
val stats = statPages.items.concat().select { id and statistics.all() }.parse() statsJoin the existing cleaned data with the newly fetched statistics. This merges two sets of data into a comprehensive DataFrame:
val joined = clean.join(stats) joined
This example demonstrates how to clean, reorganize, and enhance your dataset using Kotlin DataFrame's various functions. Each step is designed to refine the data, making it more suitable for in-depth analysis.
Analyze data in Kotlin Notebook
After you've successfully fetched and cleaned and refined your data using functions from the Kotlin DataFrame library, the next step is to analyze this prepared dataset to extract meaningful insights.
Methods such as groupBy for categorizing data, sum and maxBy for summary statistics, and sortBy for ordering data are particularly useful. These tools allow you to perform complex data analysis tasks efficiently.
Let's look at an example, using groupBy to categorize videos by channel, sum to calculate total views per category, and maxBy to find the latest or most viewed video in each group:
Simplify the access to specific columns by setting up references:
val view by column<Int>()Use the
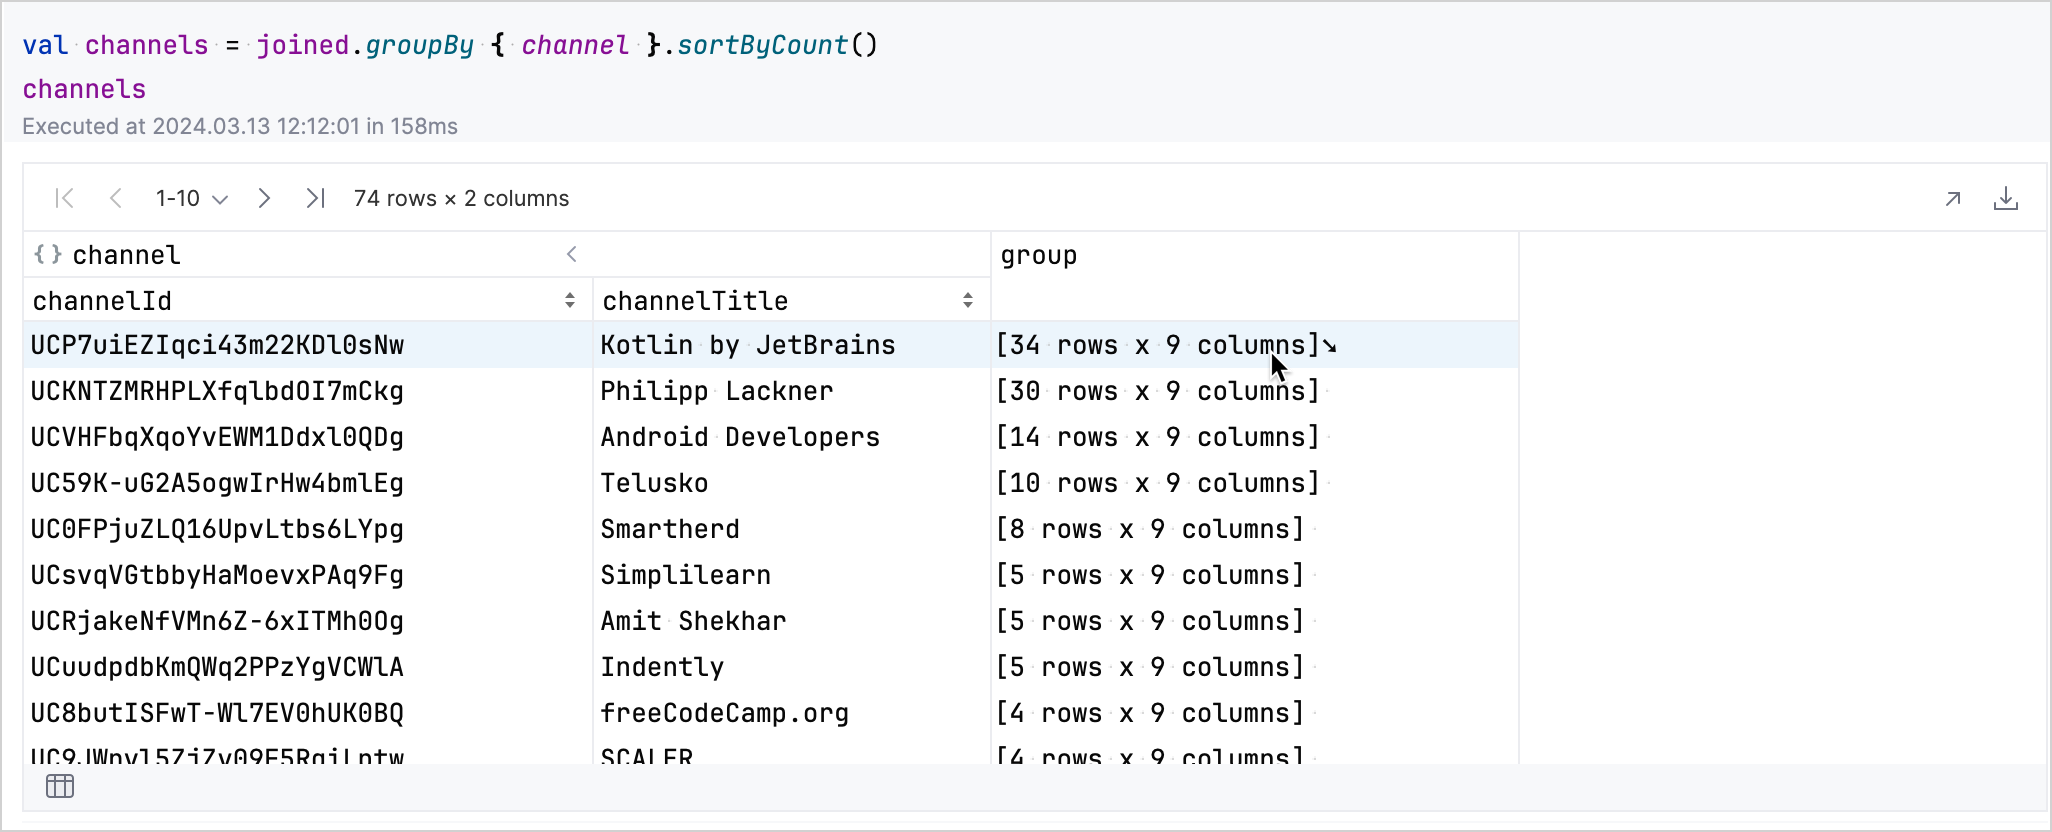
groupBymethod to group the data by thechannelcolumn and sort it.val channels = joined.groupBy { channel }.sortByCount()
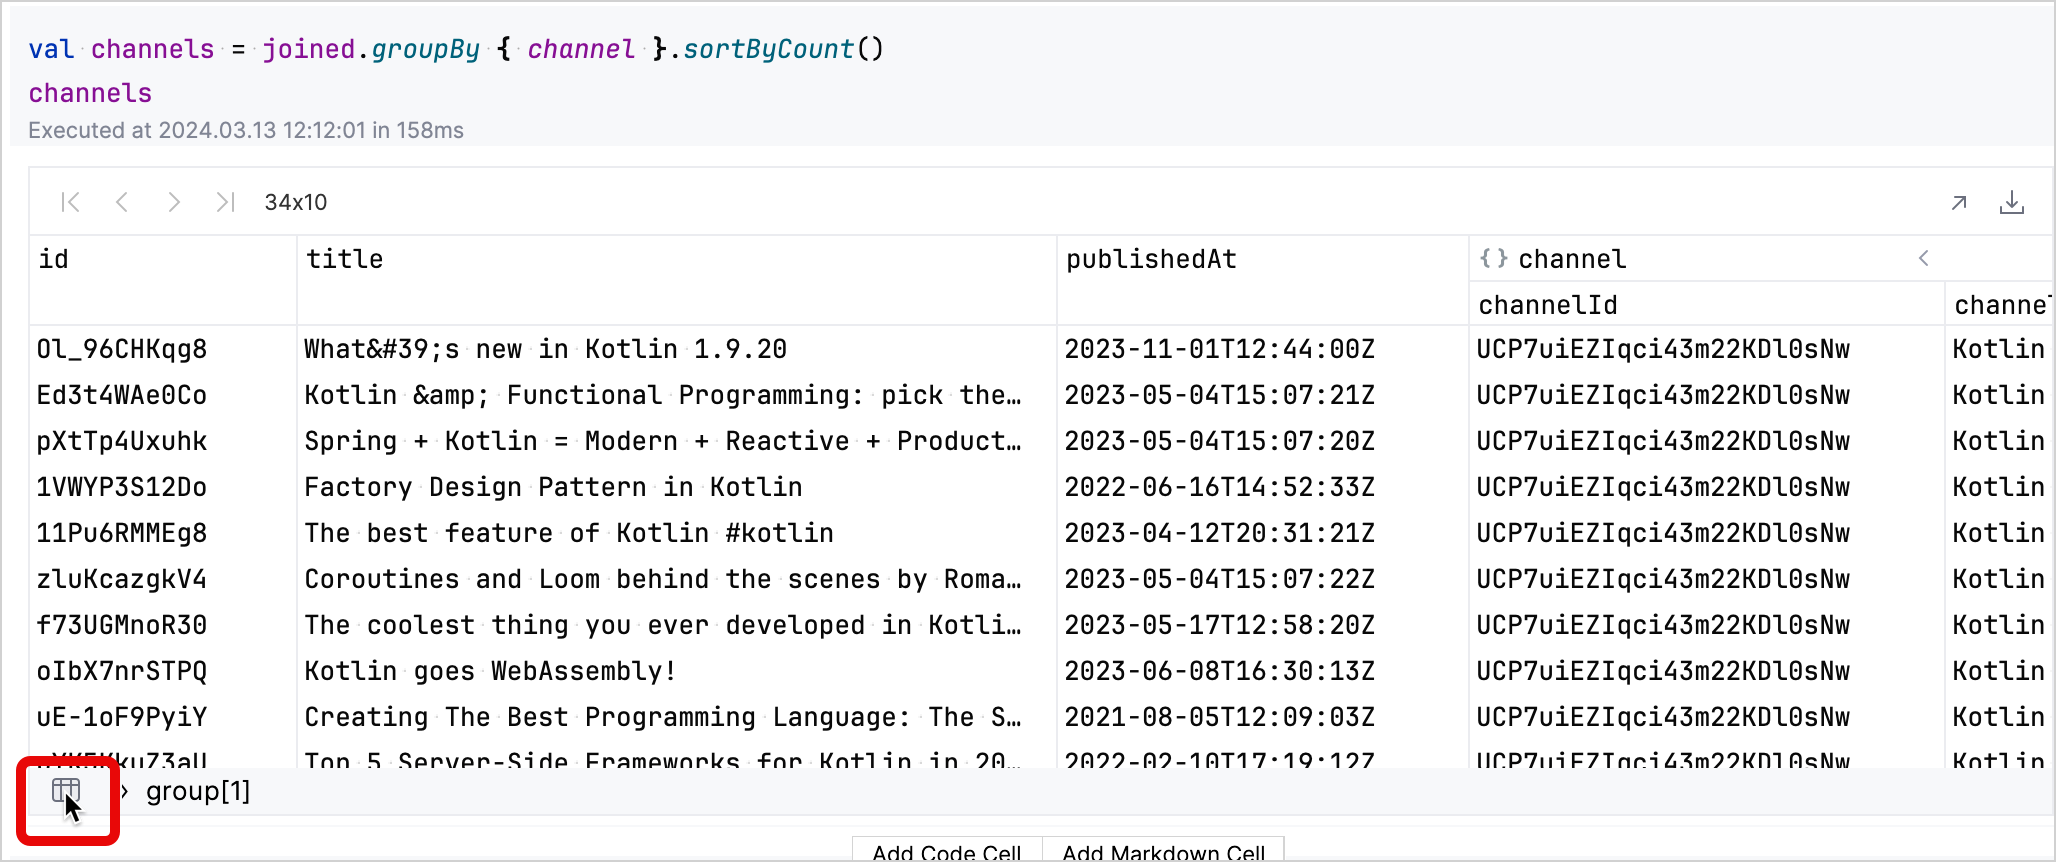
In the resulting table, you can interactively explore the data. Clicking on the group field of a row corresponding to a channel expands that row to reveal more details about that channel's videos.

You can click the table icon in the bottom left to return to the grouped dataset.

Use
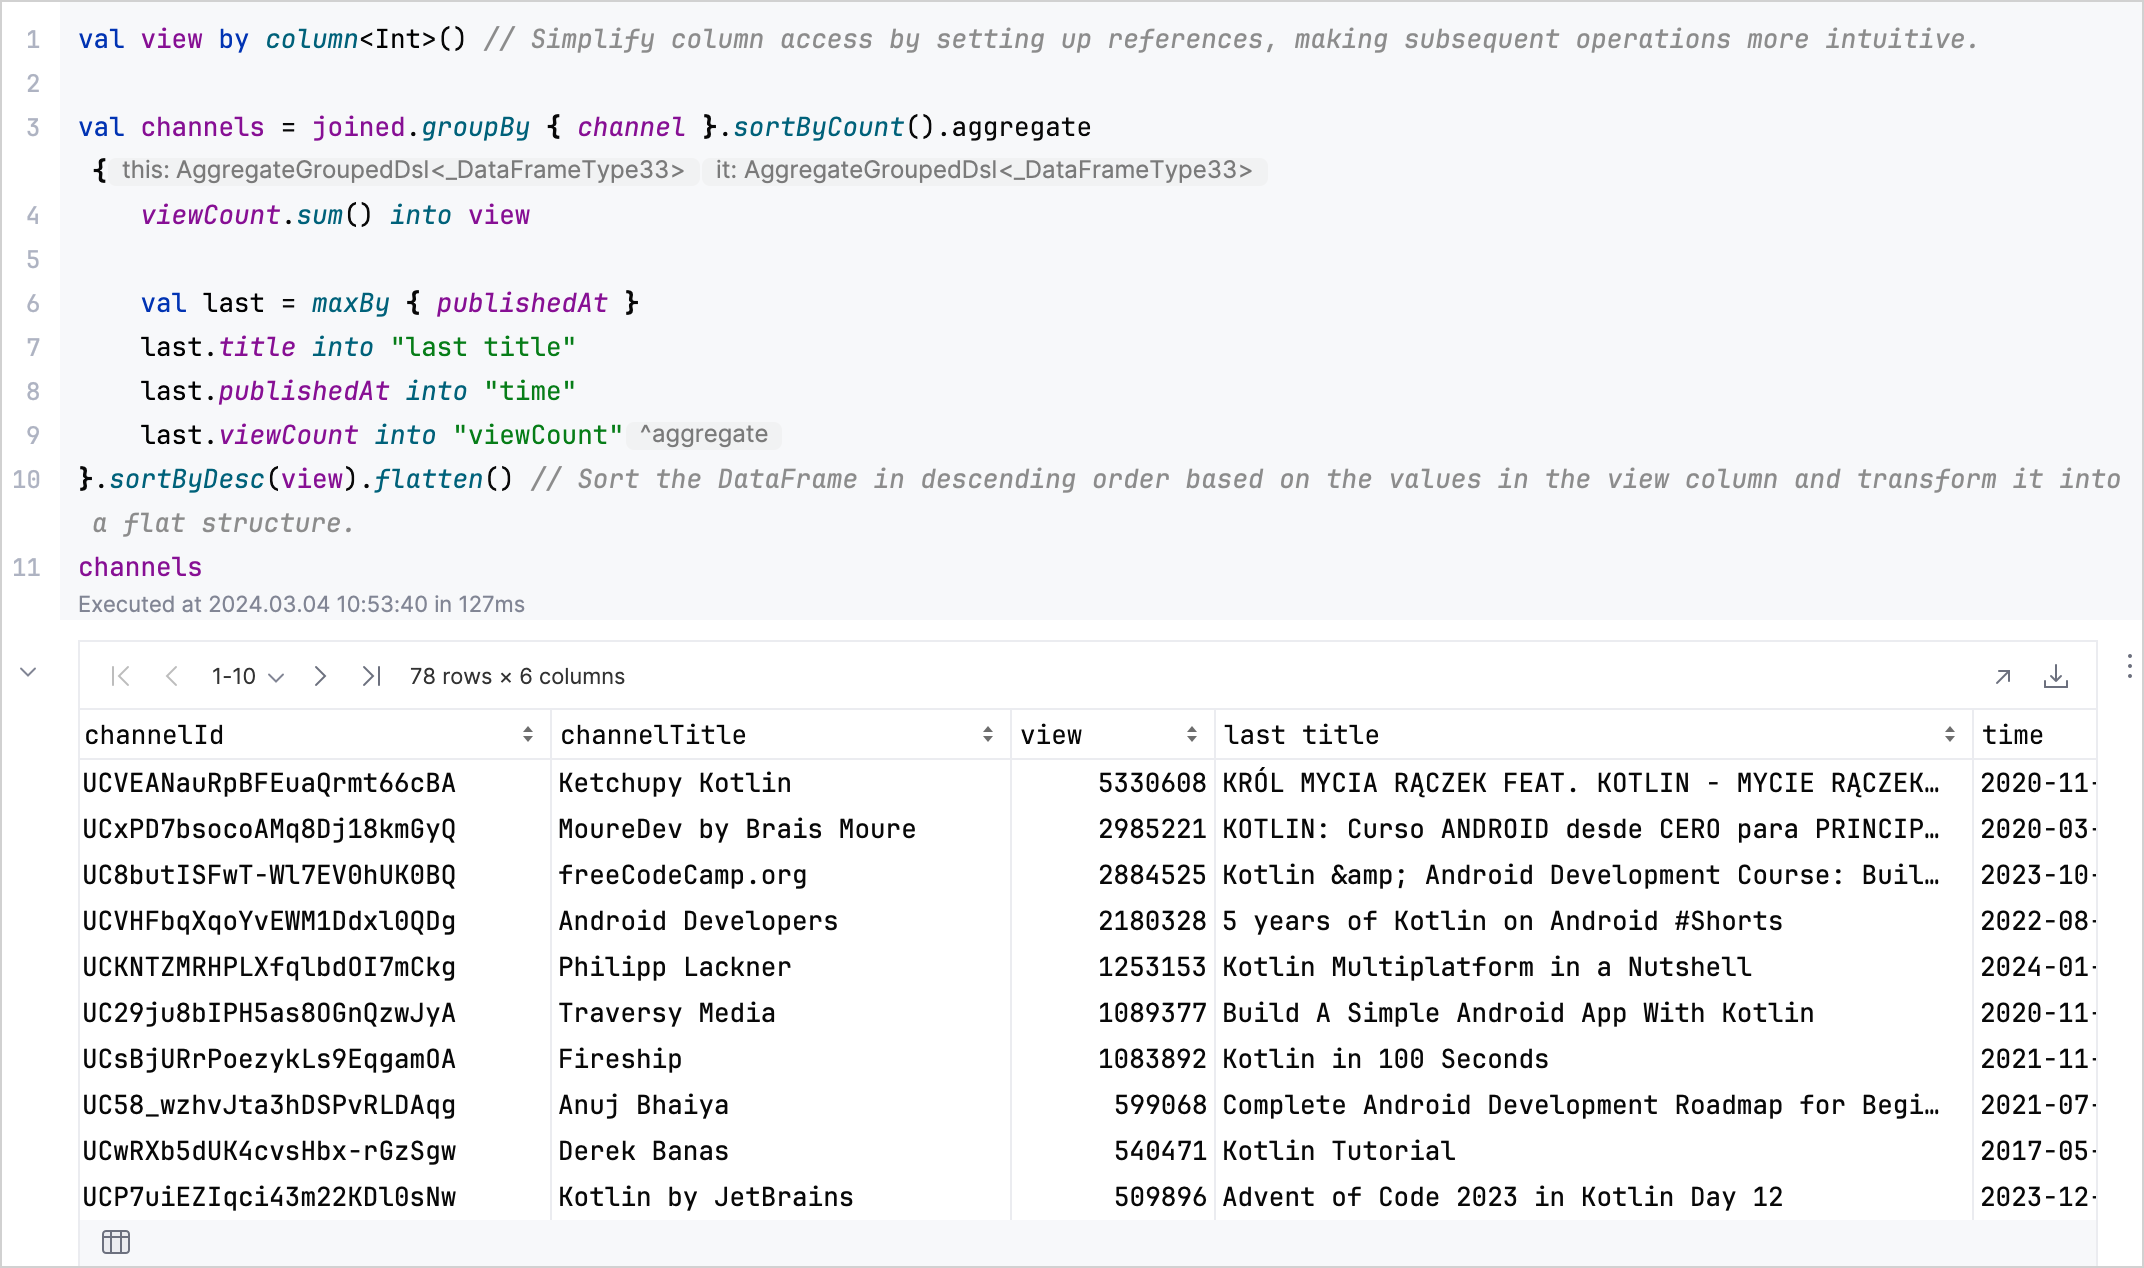
aggregate,sum,maxBy, andflattento create a DataFrame summarizing each channel's total views and details of its latest or most viewed video:val aggregated = channels.aggregate { viewCount.sum() into view val last = maxBy { publishedAt } last.title into "last title" last.publishedAt into "time" last.viewCount into "viewCount" // Sorts the DataFrame in descending order by view count and transform it into a flat structure. }.sortByDesc(view).flatten() aggregated
The results of the analysis:

For more advanced techniques, see the Kotlin DataFrame documentation.
What's next
Explore data visualization using the Kandy library
Find additional information about data visualization in Data visualization in Kotlin Notebook with Kandy
For an extensive overview of tools and resources available for data science and analysis in Kotlin, see Kotlin and Java libraries for data analysis